The profitability of a production system depends largely on the effidiency of thesystem. In order to optimally utilize a system, its bottleneck must be found.
Projektteam
Julian Haasis, Benjamin Arff
Forschungsgruppe Internet of Things (IoT), Institut für Digitalen Wandel (IDW), Forcam GmbH
Overall effciency
The profitability of a production system depends largely on the effidiency of thesystem. In order to optimally utilize a system, its bottleneck must be found.
The detection of bottlenecks in complex production systems is not a trivial problem. One of the main problems is the dynamics of real systems.
Simplifying this problem is one of the most important factors in terms of ef ciency. The goal is to look after an intelligent solution for visualizing data in such a way that experts easily can detect bottlenecks and improve the overall system.
Identifying a bottleneck
To determine a bottleneck in a production system, there have been developed several methods, such as for example:
- Active period method
- Average active period method
- Minerva: A Reinforcement Learning-based Technique
- Shopf oor bottleneck detection
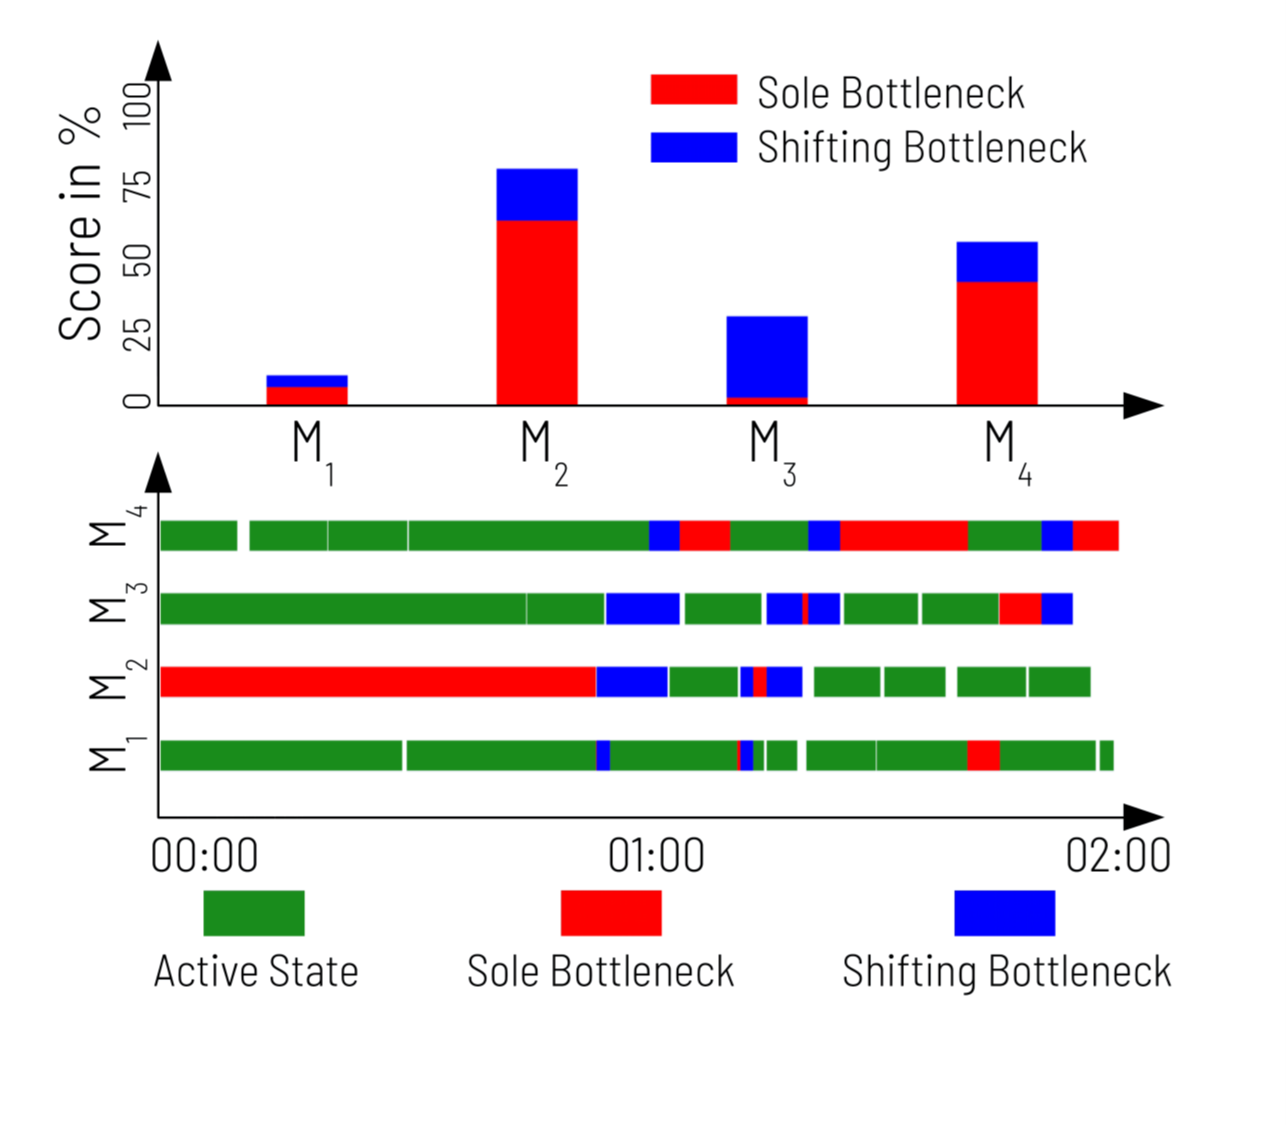
In this project the active period method has been used because of the simple heuristics, which splits up bottlenecks into shifting and sole bottlenecks. An example is shown in the following picture.
Active Period Method
The idea of the active period method is, that the longer a process is running without interruption (starvation or blockage), the more likely it is the bottleneck.
So that most likely other machines get blocked or starved. The two fundamtental rules are:
- At any given moment, the process with the longest uninterrupted active period is the bottleneck.
- During the overlap at the end of the current longest uninterrupted active period and the new one, the bottleneck shifts
Optimizing the bottleneck score
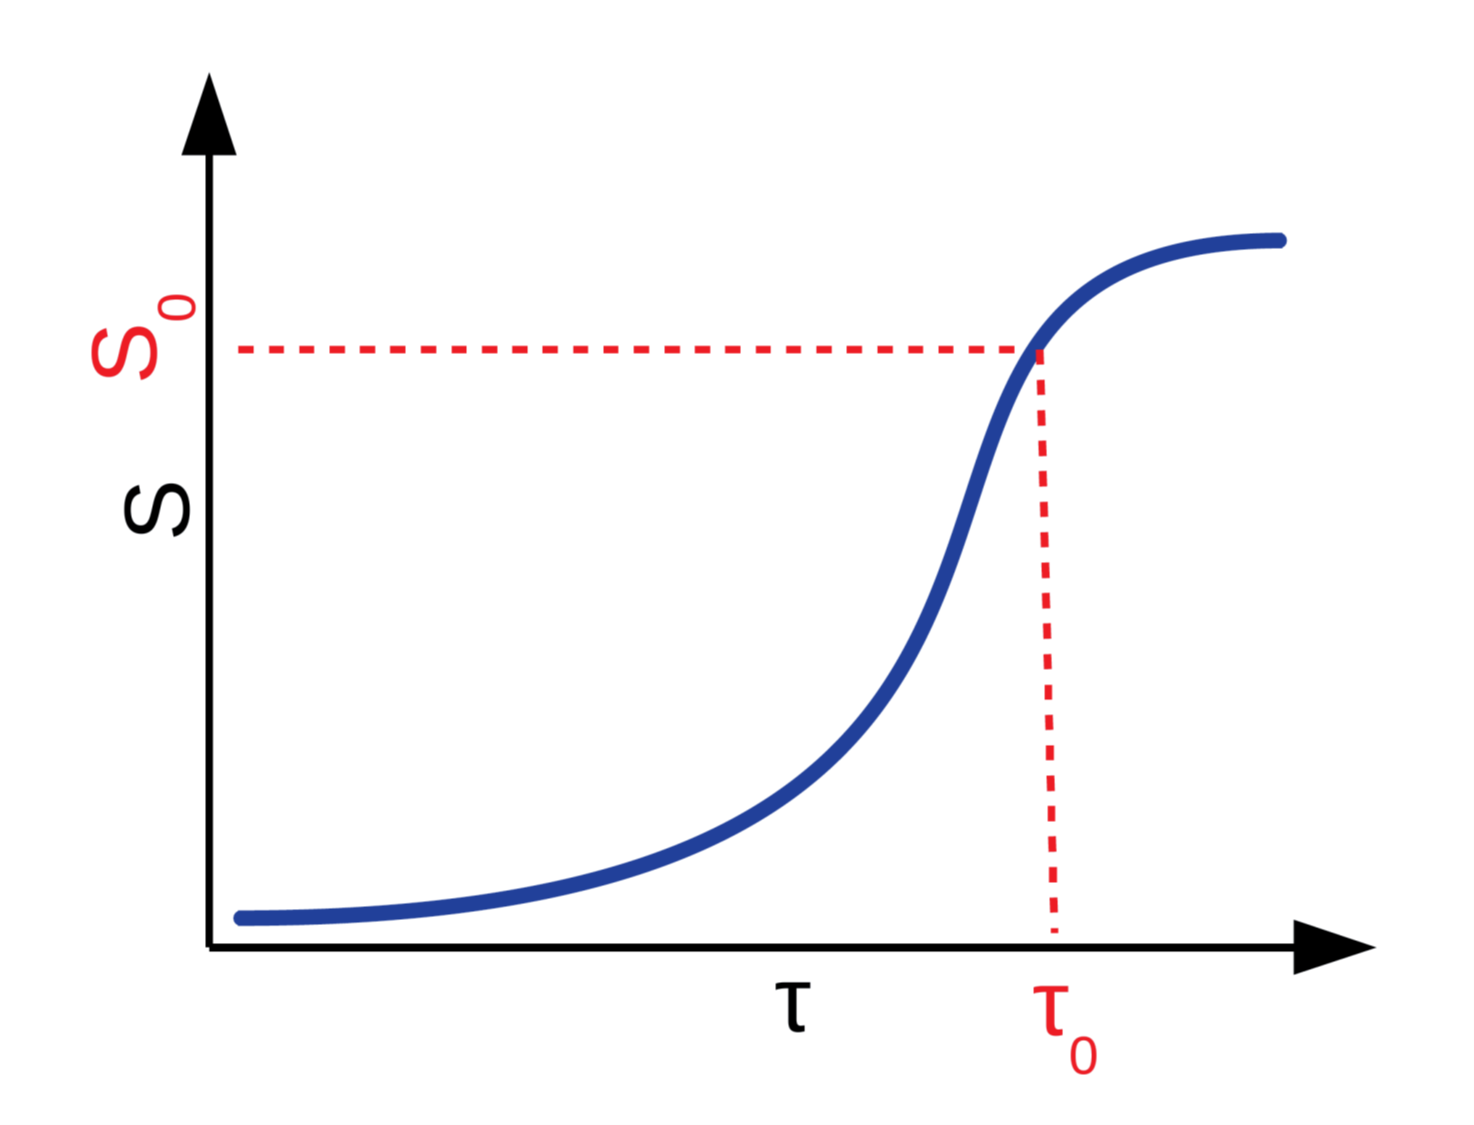
Another idea we came up with, is using the active period method as heuristic for optimizing the production system. Therefore a simulation of the system is needed. The question to be solved is how the mean time τ of each machine should be chosen so that the bottleneck score (S) is minimal. A possible sketch of this dependency is shown in the graph above. After obtaining the optimal cycle times the new throughput can be simulated and the benef t calculated. So it can be calculated if new machines could be economically reasonable.
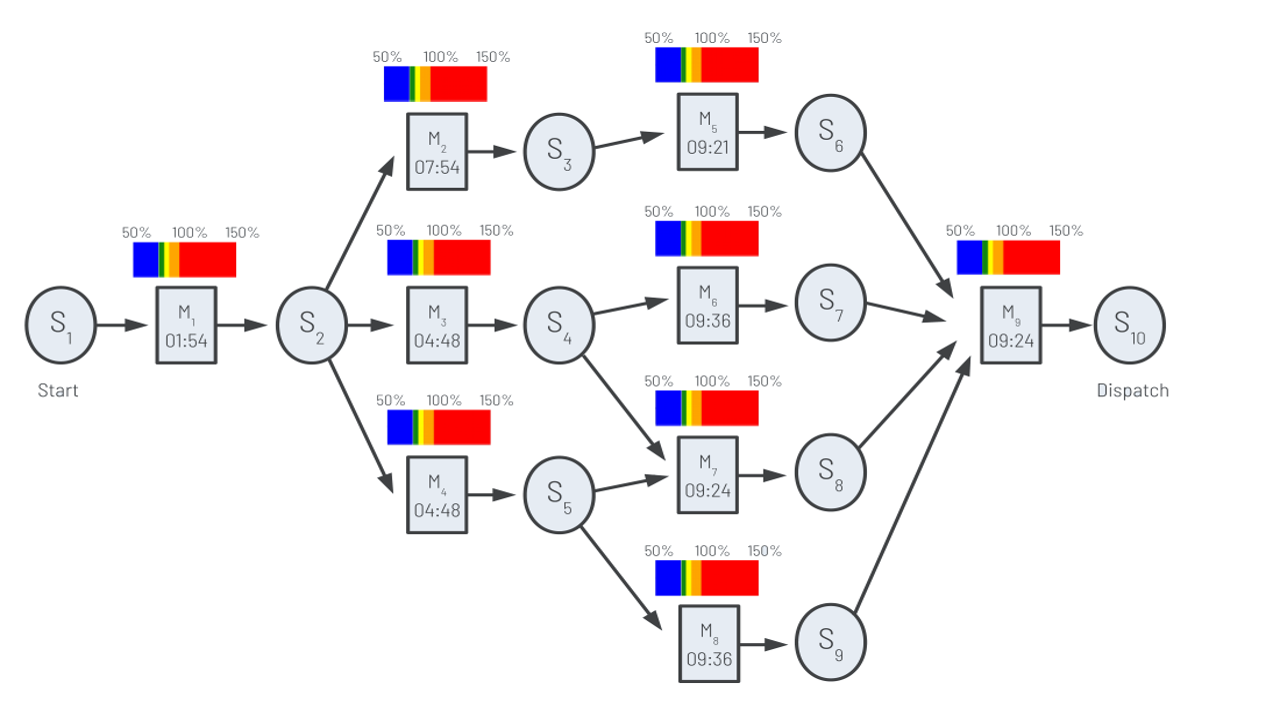
Process Heatmap
If every machine has only shifting parts and they are evenly distributed, the observed machine pool would be optimally balanced. The idea is to improve the worst machine until the sole bottleneck component is gone. If this is going to be applied for each machine one after another the system is optimal balanced and the throughput optimized. To achieve this the cycle times of all machines are f xed except of one.
For this machine the cycle is varied from 50 to 150 percent of the calculated median. Afterwards the active period is applied and a sole bottleneck score is the result. Doing this for each machine these scores from 50 to 150 percent can be displayed as a beam.
Results of Active Period Method
To get the active periods for calculating the active period method, the time series of operating states of the different machines is necessary.
This time series then has to be converted into active periods. The most important step is to preprocess the data.
As in smart manufacturing a lot of data is gathered, the data foundation is not always cleaned up and ready for further processing.
After preprocessing and evaluation an expert says that the benef ts of the method are:
- Good discussion foundation
- Quite accurate
- Quality of production management can be measured and supervised